Infographics
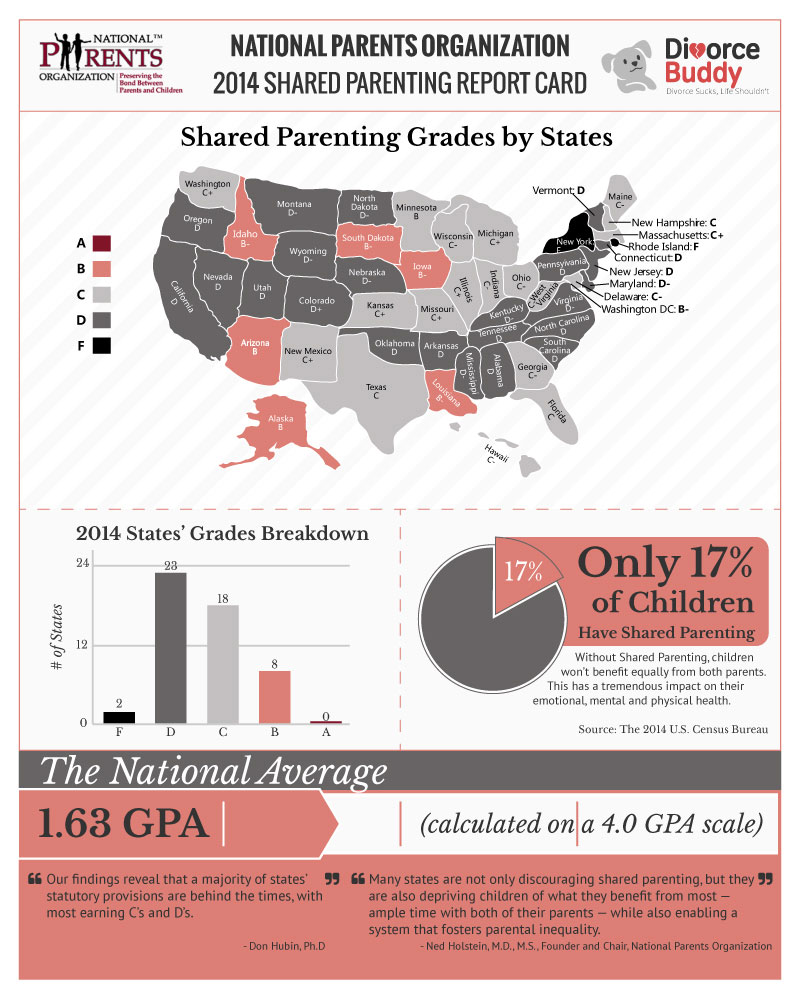
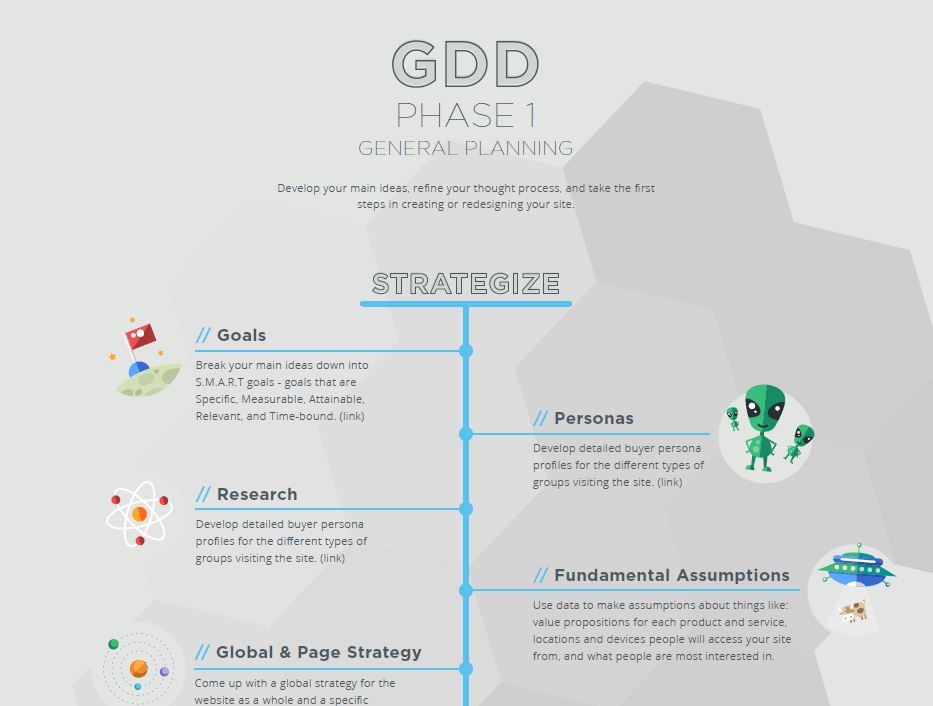
Not all infographics have stats blown up with wonderful charts. This recent storygraphic I designed required a good sense of the written content hierarchy and flow.
My first infographic was an undergrad psychology research poster built on a really large PowerPoint file. As I grew into the designer role, these infographics were designed with Adobe Illustrator and InDesign, for digital and print.